Customer Segmentation
Market research is an essential business activity that helps you to identify and analyse market demand, market size, market trends and the strength of your competition. It also enables you to assess the viability of potential new products or services before taking them to market. Quantitative market research is a field that recognises the importance of utilising data to make evidence-based decisions using a wide variety of statistical and analytical methods.
In our Market Research terminology blog series, we discuss a number of common terms used in market research analysis and explain what they are used for and how they relate to established statistical techniques. Here we discuss “Customer Segmentation”, but have a look at our other posts on Key Driver Analysis, Maximum Difference Scaling and CHAID, and watch out for new articles on TURF and Brand Mapping, amongst others, coming soon. If there are other terms that you’d like us to blog on, we’d love to hear from you so please do get in touch.
What is it for?
Customer segmentation (sometimes also referred to as market segmentation) breaks down large groups of current and/or potential customers in a given market into smaller groups that are “similar” in terms of their preferences or characteristics. This allows you to adopt a different marketing mix (e.g., combination of price, product, promotion, and place) for each segment of the market. The same methods can also be used to select and target the best prospects, identifying those customers with the highest likely lifetime value or conversion rate, for example.
“Target your best prospects.”
Segmentation can be based upon a variety of factors including demographics, geography and spending behaviours as well as perceived needs and values. Traditionally, segmentation has focussed on identifying customer groups based on core demographics and values. However, value-based segmentation is now increasingly common. In this case we also group customers using variables that capture the revenue they generate, e.g., their lifetime value, and the costs of establishing and maintaining a relationship with them.
The segmentation process often begins by taking the most obvious market segments, such as male, female, teen and adult (so-called “a priori” segments) and breaking them up into smaller segments that are made up of actual or potential customers with specific shared characteristics. These characteristics are carefully selected as being those likely to affect customer behaviour and the segmentation process determines the relative importance of each in order to ensure that the final segmentation is of practical commercial value. See our recent blog post, “How Do Supermarkets Use Your Data?“, for a great example of the power of customer segmentation in creating accurate customer profiles to improve the targeting of products and services.
Customer segmentation can be used in both business to business (B2B) and business to consumer (B2C) sales and marketing. In the case of B2B, the “customers” that we are segmenting are businesses rather than individuals and so the characteristics on which we segment might differ, but the underlying statistical techniques used are just the same.
Data from an account or customer relationship management database are often used in customer segmentation as they provide a great resource of customer attributes. Additional data from other sources, including external databases, can also be used to supplement your own and allow you to consider potential as well current customers.
What statistical techniques are used?
 A number of different statistical techniques can be used in performing customer segmentation. We discuss two of the most common methods (clustering and predictive modelling) below, but other classification techniques, such as random forests and mixture models (or latent class analysis) can also be used.
Clustering
Clustering is a so-called “unsupervised” analysis that is designed to categorise observations (in this case customers) into a number of different groups (“clusters”), with each being relatively similar based on their values for a range of different factors. In each case, some form of distance measure is used to determine how close together or far apart different customers are based on their attributes.
There are many flavours of clustering methods depending upon how you measure the distance between points within and between clusters and also on how you explore the different groupings. For example, we can use Ward’s distance which seeks to minimise the total variance between points within each cluster. Then, in order to construct the best clustering, we might use an iterative procedure starting with every point being assigned to its own cluster and then merge clusters successively so as to minimise the increase in the Ward’s distance. The process continues until there’s just one cluster containing all the observations. A so-called dendrogram (see Figure 1 for example) can be produced that shows which clusters are merged at each step and the associated variance total, allowing us to select the most appropriate number of clusters.
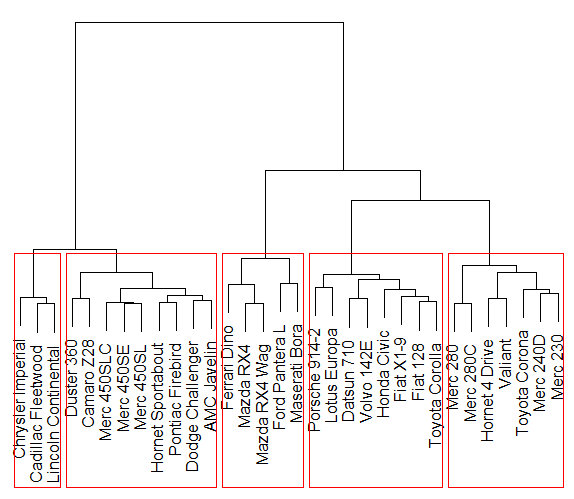
Figure 1: An example dendrogram for a hierarchical cluster analysis with five final clusters.
There is a subjective element to using these clustering techniques. Following the analysis, we would need to review the data and identify what the members of each cluster have in common in a meaningful and practical sense. Similarly, we can check that members of distinct groups differ in some obvious and relevant manner. This can be done by summarising the characteristics of each cluster and potentially visualising these summaries as a means of comparing them, e.g., using circle plots where the relative size of each circle corresponds with the relative magnitude of a given characteristic for each cluster compared with the overall average. This process can also help to determine how many segments are needed.
K-means clustering is probably the most popular clustering (or partitioning) method for customer segmentation and requires the analyst to pre-specify the number of clusters required. The method works by assigning each observation to a cluster and then calculating the distance between each point in that cluster and the mean value of all the observations in that cluster. The points are assigned to the clusters so as to minimise the total (squared) distance between each observation and the corresponding mean. Figure 2 shows an example where a group of customers have been segmented based on their sensitivity to price and brand loyalty.
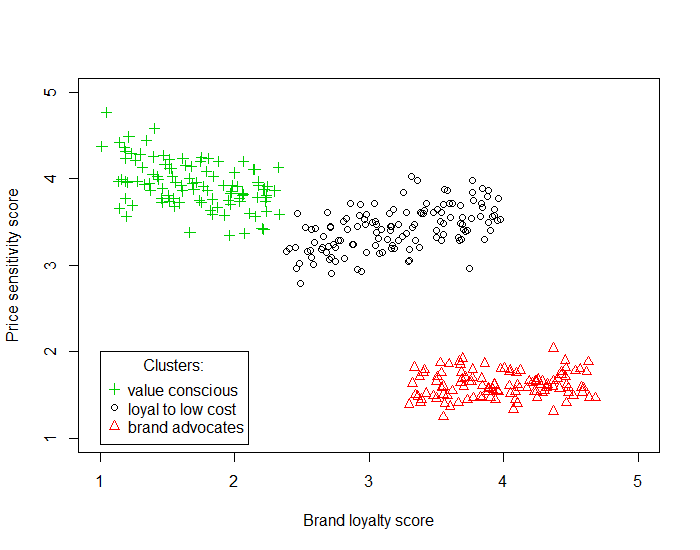
Figure 2: An example of a 3-means cluster analysis
There’s often a great deal of subjectivity associated with cluster analysis with the number of clusters being determined based upon the usability and usefulness of the corresponding groupings. The final clusters are often given names that summarise their key traits, such as “young, upwardly mobile” and “double income, no kids”. In the example in Figure 2, we have identified the three distinct clusters as “value conscious”, “brand advocates” and “loyal to low cost” customers.
In this example it’s very easy to identify the three groups “by eye” in Figure 2. However, if we wanted to include more customer attributes, we would have more than two dimensions and it would be much harder to identify the groups. We couldn’t split the three groups above by looking at either axis (i.e., attribute) on its own, in one dimension, as the groups overlap in terms of both their price sensitivity scores and brand loyalty scores. It’s only when we look at both scores together in two dimensions that the three groups can be easily identified. This idea of looking at multiple dimensions in combination is particularly relevant to higher-dimensional data where simply looking at a 2 or 3D plot won’t necessarily help. This is where we need statistical methods such as cluster analysis to be able to effectively look at all dimensions at once.
Dimensionality reduction techniques, such as so-called principal component analysis (PCA) or factor analysis, can also help in visualising and understanding higher dimensional data – we’ll blog about these techniques another time.
Predictive Modelling
Predictive models are a useful alternative to clustering when we have a specific definition of a “good” customer, such as their lifetime value, on which to base the groupings. In this case, we can create a model (using linear or generalised linear regression, for example) to investigate the relationships between potential drivers and customer value. Those variables that are found to be statistically significant predictors of customer value can then be used to define our customer segments. See our recent blog post on “key driver analysis” for more information on this kind of predictive modelling.
A similar approach known as CHAID (Chi-squared Automatic Interaction Detector) analysis uses an algorithm for discovering relationships between a categorical response variable and other categorical predictor variables, and we’re planning to blog on this soon.