Maximum Difference Scaling (MaxDiff)
Market research provides important information to identify and analyse market demand, market size, market trends and competition, and allows companies to assess the viability of a potential product or service before taking it to market. It is a field that recognises the importance of utilising data to make evidence based decisions. Many statistical and analytical methods have become popular in the field of quantitative market research.
In our Market Research terminology blog series, we discuss a number of common terms used in market research analysis and explain what they are used for and how they relate to established statistical techniques. Here we discuss “Maximum Difference Scaling”, but check out our other articles on Key Driver Analysis, Customer Segmentation and CHAID, and look out for new articles on TURF and Brand Mapping, amongst others, coming soon. If there are other terms that you’d like us to blog on, we’d love to hear from you so please do get in touch.
What is it for?
MaxDiff (Maximum Difference or Best-Worst Scaling) is a survey method in market research that was originally developed in the 1990’s and is used to try to gain an understanding of consumers’ likes and dislikes. Respondents are usually asked to select the most and least important attributes from a subset of product features. The question is then repeated a number of times with the list of attributes varied so that the respondent selects the best and worst features from a number of subsets of product characteristics. The goal of the research is to rank the attributes in terms of their importance to customers on a common scale, so that comparisons and trade-offs between them can be made. See below for an example of a MaxDiff question looking at the attributes of a household appliance.
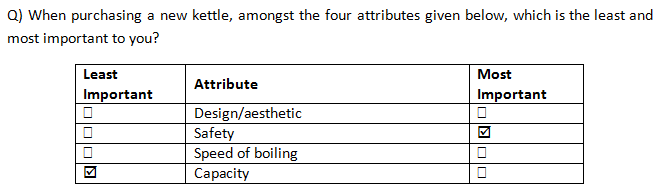
An example of a MaxDIff survey question.
The method is easy for respondents to complete and forces them to make a discriminating choice amongst attributes. There is no opportunity for bias to occur due to differences in the use of rating scales (which is commonly seen across different countries and cultures) such as those that can occur with a five-point, non-comparative scale from “Not important” to “Extremely important”, for example. Furthermore only two selections need to be made from each list, making it arguably more manageable/practical than the ranking of each item. When there are four attributes in the list, such as in the example above, we learn about five of the six pairwise comparisons between the items but from just two customer choices; it is only the comparison between the two attributes which are not selected that remains unknown. For example, from the response above we know that:
- Safety is more important than Design/aesthetic
- Safety is more important than Speed of boiling
- Safety is more important than Capacity
- Design/aesthetic is more important than Capacity
- Speed of boiling is more important than Capacity
- Design/aesthetic vs. Speed of boiling is unknown
What statistical techniques are used?
Firstly, experimental design is required in MaxDiff to construct the lists of product characteristics to be chosen from, to determine the number and combinations of attributes per question and to determine the number of questions that each respondent must complete. These are chosen so as to get the best balance of attributes within each question, maximising the information obtained whilst minimizing the burden to the respondents. Ideally, combinations are chosen so that each item is shown an equal number of times and pairs of items appear together an equal number of times. Most often, so-called balanced incomplete block (BIB), or partially balanced incomplete block (P-BIB) designs are used. Take a look at our case study “Judging at the Big Bang Fair” for another example of the application of experimental design.
A number of different approaches are used by market researchers to analyse MaxDiff survey results.
Counts analysis
A simple, so-called “Counts analysis” approach involves calculating the difference between the numbers of times each item is chosen as best and worst (termed the “count”) and then ranking the attributes based on these differences. This can be done at both the individual respondent level and also aggregated over all respondents. However, this method fails to take the experimental design of the survey into account and, for example, doesn’t use the information obtained when two items appear together in a list to distinguish between those with a tied count. Furthermore, if the experimental design was unbalanced, and so some items appeared more often than others, counts analysis will give biased estimates as items that appear more frequently will have had more opportunities to be chosen as best or worst.
‘Tricked’ logistic regression models
Alternatively, random utility (or discrete choice) models, such as logistic regression models, are commonly applied to MaxDiff data. Logistic regression models are designed to predict the probability of a binary dependent variable (e.g., a yes/no response) via a linear combination of independent explanatory variables. The MaxDiff experiment, though it involves discrete choices, clearly does not fit into this design. A trick however is therefore used to apply the methodology in this case.
The “trick” involves separating out the responses for each attribute in each list as a binary outcome (chosen or not chosen) for the dependent variable and then using dummy variables for the independent variables to indicate which attribute the response corresponds to and whether it was select as best (1) or worst (-1). The coefficients for each attribute from the fitted model are then directly compared to give a rank ordering for the attributes in terms of customer preference. They are often also transformed and interpreted as estimates of the relative probabilities of each item being chosen as the best. So, for the example above, we might find that the design/aesthetic of the kettle has the highest “share of preference” with approximately 40% chance of being selected as most important compared to the other attributes in the list.
There are a number of issues with this analysis approach. Most importantly, the assumption of responses being independent, which the logistic regression model relies upon (and in fact almost all statistical techniques do), is clearly violated as each choice will be affected by the attributes that were available to select in the current list, and best and worse choices will clearly be correlated. Therefore, the resulting parameter estimates will be biased and cannot be relied upon.
Rank-ordered logistic regression models
A more robust analysis that can be applied to MaxDiff involves applying a rank-ordered logistic regression or “exploded logit” model. This allows us to model the partial rankings obtained from the responses to the MaxDiff questions (see the bullet point list above, for example), whilst accounting for the ties. This approach does not violate the independence assumption like the tricked logistic regression model above and, as before, allows you to estimate the rank ordering of the attributes in terms of customer preference or to estimate probabilities of attributes being selected as the best.
Despite this approach being more statistically sound, there are still questions over the interpretability of the results. In particular, we are only assessing the relative importance/desirability of the attributes and so it is crucial to carefully consider the product features to be included upfront. The results also don’t indicate if any of the features are likely to actually impact customer behaviour, and furthermore customers’ responses (self-stated importance) won’t necessarily reflect what they actually want.
Alternative approaches
As the MaxDiff best and worst selections only depend upon the rank ordering of the attributes and their analysis simply provides estimates of the rank ordering of attributes, it may be simpler to directly ask consumers to rank the attributes in the first place. Although this approach is slightly more intensive for respondents, it is simply a case of repeatedly asking for the most important attribute from a decreasingly long list of items. This also simplifies the data collection process as we no longer need to generate experimental designs.
The rank-ordered logistic regression models described above are explicitly designed to analyse these sorts of data and allow us to estimate and test for differences among items in respondents’ preferences for them. It’s also simple to incorporate predictor variables accounting for respondents’ or items’ characteristics, or both, that allow us to investigate what characteristics affect the rankings.
Related Articles
- What’s Your Preference? Asking survey respondents about their preferences creates new scaling decisions (Steve Cohen & Bryan Orme)
- The MaxDiff Killer: Rank-Ordered Logit Models
- Why doesn’t R have a MaxDiff package?